[R]Redliner: How LinkedIn Determines the Capacity Limits of Its Services
LinkedIn serves more than 467 million members on a global computing infrastructure through hundreds of internal services. During processes such as new feature releases, capacity planning for traffic growth, and data center failover analysis, the following questions are raised frequently:
- “What is the maximum QPS (queries per second) that my service can sustain with its current setup?”
- “Can the current number of servers handle 50% more traffic volume than the current level of peak traffic?”
- “What infrastructure elements are the potential capacity bottlenecks for my service?”
As LinkedIn’s performance team, it’s our job to provide accurate answers to these questions in a timely fashion.
However, due to the nature of rapid-growing web services like LinkedIn, we face big challenges when trying to measure service capacity limits. These challenges come from the constantly changing traffic shape, the heterogeneous infrastructure characteristics, and the evolving bottlenecks. In order to determine service capacity limits accurately and pinpoint capacity bottlenecks effectively, we need a solution that:
- Leverages the production environment to overcome lab limitations;
- Uses live traffic as the workload;
- Has minimal impact on our member experience;
- Has low operational cost and overhead;
- Scales through automation.
Our solution: Redliner
Redliner is our solution for providing automated capacity measurement and accurate headroom analysis in the production environment using live traffic. Redliner measures the service throughput by performing stress tests that gradually increase the rate of live traffic to a target service instance until it determines the instance can no longer safely handle any additional load.
Redliner’s design provides an automated way of diverting production traffic with minimal impact to the site and end users. We built this solution with two key design principles in mind: low impact to production and complete automation.
Low impact
One of the major concerns with redirecting live traffic is the potential impact on the site and end users. Redliner uses the following strategies to mitigate the impact to production performance. First, the portion of additional traffic navigated to the redline instance is increased incrementally. Second, Redliner monitors the service health in real time and adjusts the traffic distribution accordingly. Redliner captures real-time performance metrics and determines the health of a service based on the results of health evaluation rules in EKG (see examples of inbound and system metrics in Figure 1 and Figure 2 below). In addition, Redliner evaluates the redline test impact on the downstream and upstream dependent services during tests.
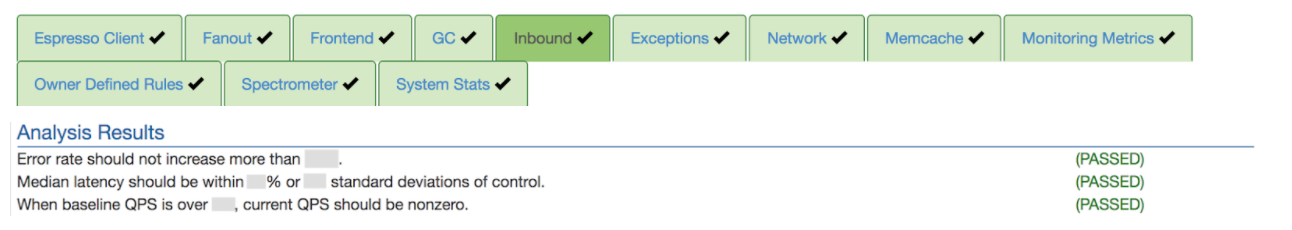
Figure 1: Examples of Redliner inbound metrics rules
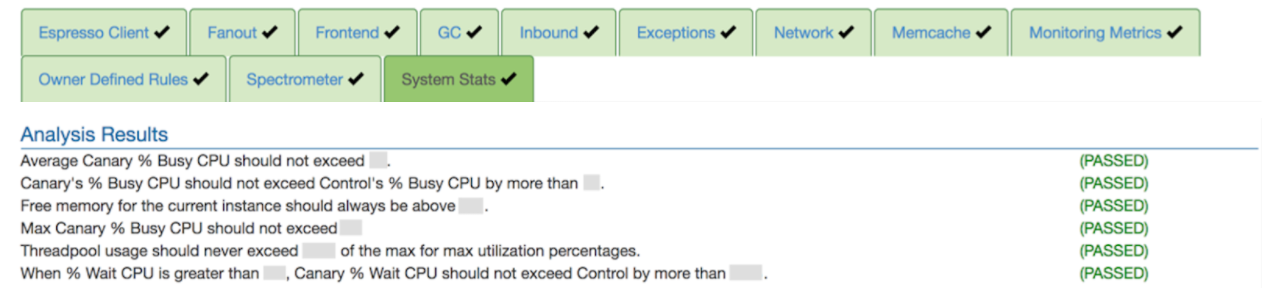
Figure 2: Examples of Redliner system metrics rules
Complete automation
To overcome the drawbacks of manual testing (like lack of consistency, high operational cost, etc.), we wanted a completely hands-off approach for kicking off the tests, determining throughput capacity, checking on alerts for system performance degradations, and gracefully stopping or reverting in the event of problems. We are able to automate these processes in Redliner while using the LinkedIn stack to make it robust and scalable. Redliner can kick off a test based on schedule, check performance health status via EKG, and leverage the A/B testing platform XLNT to dynamically adjust the traffic portion diverted to the target service instance. After several iterations (explained below), Redliner finally determines the maximum throughput QPS that a single instance can handle. The entire end-to-end process typically takes less than an hour. Redliner also generates test reports with QPS and identifies latency trends and resource bottlenecks, if any, at the end of each test. If a service is over- or under-provisioned, Redliner sends regular email reports to stakeholders with specific recommendations.
Redliner ecosystem
Figure 3 represents the high-level architecture of Redliner and shows its interaction with key components to achieve traffic diversion and capacity evaluations. There are several key components: 1) traffic diversion layer (proxy/load balancers), 2) service health analyzer, and 3) service metrics collector.
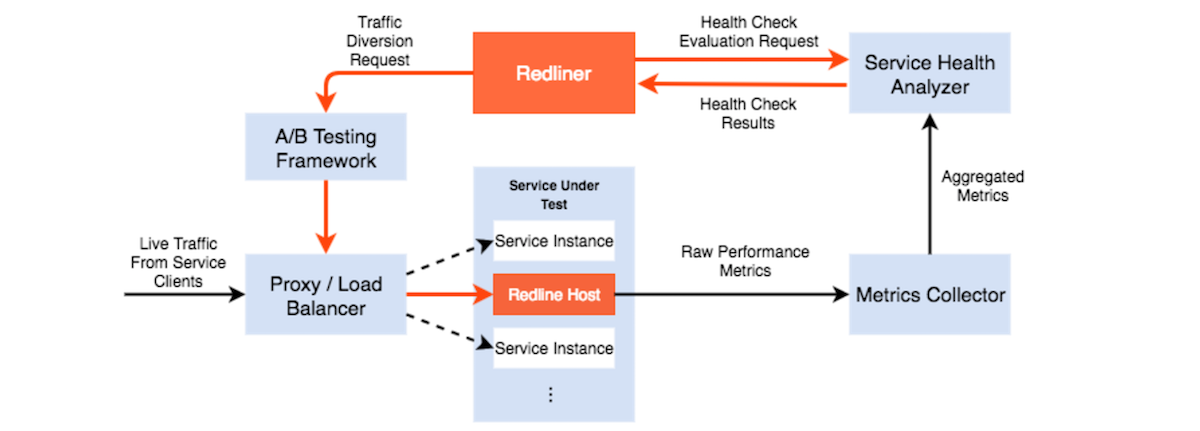
Figure 3: Redliner and its dependent components
Traffic diversion layer (proxy/load balancers)
Currently, Redliner supports only stateless services; that is, those services whose requests can be routed to any available servers/instances for the SUT (Service Under Test) in the data center without using sticky sessions. The traffic load of these services is controlled by re-routing requests through load-balancing mechanisms that makes dynamic traffic diversion possible.
The traffic diversion layer is the key component that enables Redliner to achieve dynamic traffic shifting. Redliner determines the traffic level to apply to the target instance and communicates with LiX, LinkedIn experimentation service, to translate the expected traffic level into specific configuration changes onto the proxy and load balancers. LiX is the default way of ramping traffic at LinkedIn (as well as A/B testing); it provides a more controllable and secure way of traffic shifting through the underlying infrastructure. By changing the configurations for the proxy and load balancers, Redliner is able to automatically control the amount of traffic flowing from service clients to the target instance.
Metrics collector
Capacity measurement and headroom analysis is based on the evaluation of performance metrics to determine if the SUT is nearing capacity. All LinkedIn services emit metrics to Autometrics, which is a push-based, real-time metrics collection system. Redliner leverages Autometrics to achieve real-time data retrieval for both system-level and service-level performance metrics, such as QPS, request latency, error rate, and CPU/memory utilization.
Service health analyzer
Redliner’s service health tool, EKG, analyzes the performance metrics mentioned above to determine the overall health of a service. EKG provides this analysis by running health check rules against the selected performance metrics. Redliner queries EKG for performance comparisons between a normal traffic load and the current load of the service. It also queries health check results on traffic diversion decisions for subsequent ramp steps.
Redliner in action
To determine the capacity limit of a service, Redliner incrementally stresses a SUT instance against different traffic levels. After applying the traffic load changes to the target instance, Redliner waits for EKG to respond with health check results based on the performance metrics. If a health check fails, Redliner will reduce the traffic level; otherwise, it will keep increasing traffic to create additional stress. Redliner relies on this performance feedback loop for traffic level decision making. It iterates the above steps until it has enough confidence to produce a valid redline number, which is the highest throughput capacity that the service can handle without service degradation.
Figure 4 shows an example of Redliner test details. In this case, as the SUT has a redline number on record (marked in red dotted line as “Target Redline”), Redliner triggers the fast ramp algorithm by ramping the traffic load to the target redline QPS in a few steps, thus improving the test efficiency and reducing the test duration. It then keeps ramping traffic to the target instance until it reaches a QPS at which the service instance CPU utilization and inbound call latency increases dramatically, which violates the service health check evaluation rules. Redliner then ramps down the traffic load to the target instance. After several such iterations of traffic adjustment, Redliner determines the service redline number.
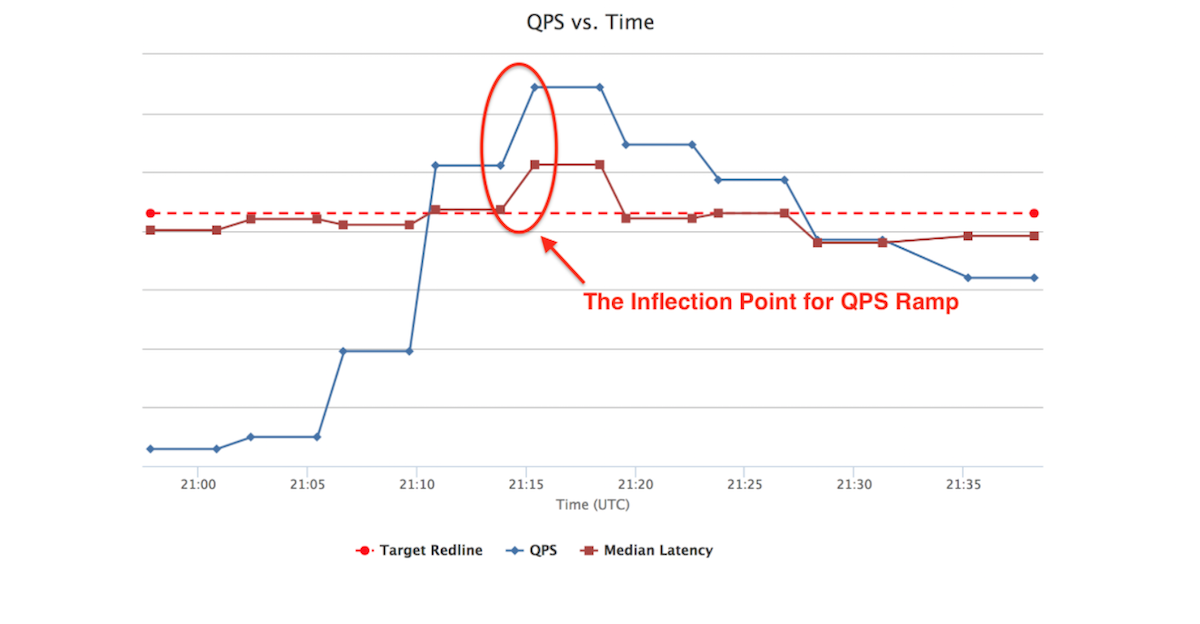
Figure 4: Redliner test results summary: QPS and Latency vs Time
Use cases
Redliner has been widely used across LinkedIn to serve multiple purposes, including the following.
Reducing data center costs
Usually, services are provisioned with resources and future growth projection in mind. But due to many factors, such as feature deprecation and incorrect growth estimates, the resource that has been provisioned can be underutilized at times, which can be difficult to determine. By creating periodic redlines, we can identify such over-provisioned services and reclaim/reuse the hardware for other areas.
An example of over-provisioning is when a Redliner test terminates because 100% of traffic has been shifted to the target redline instance without experiencing a service health evaluation failure. Engineers can then reduce the number of redline instances in production or leverage LPS to redistribute resources more efficiently. Figure 5 shows an example of service server cost reduction after reclaiming resources in production with Redliner capacity guidance.
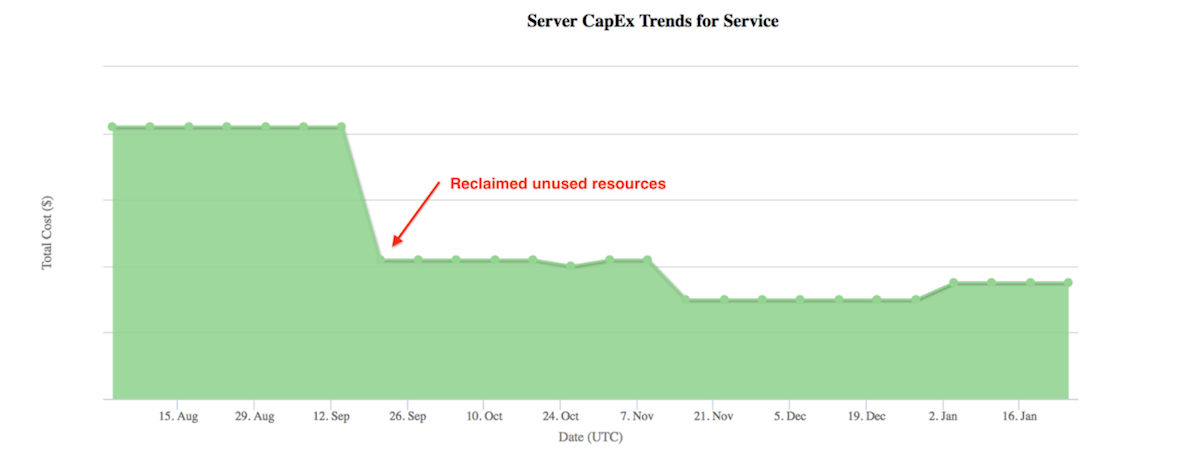
Figure 5: Example of service resource expense reduction trend
Proactive capacity planning
Capacity issues identified in production are always expensive to mitigate. By automating the Redliner tests for services, service owners and operations teams receive alerts on potential capacity risks. As Redliner identifies the exact resource contention, whether it’s CPU, memory, network, threadpool, etc., the mitigation plan becomes easier. What’s more, by examining the capacity history and by visualizing the redline QPS trend, engineers can apply forecasting models and make appropriate estimations, thus planning for required resources ahead of time to sustain usage growth and traffic surges.
Detecting throughput regression
Engineers can use Redliner to detect regressions between application versions and identify new resource bottlenecks through automated tests. Redliner supports running tests side-by-side for canary and production instances. This allows engineers to run the same level of traffic on two different service instances: 1) a service instance that contains new changes, that is, configurations/properties or new code, and 2) a service instance with the current production version. The load-testing results are used as part of deployment decisions and have successfully prevented deployment of code with a potential performance regression.